2017. 7. 2. 22:17ㆍ세계정세
아래글은 KWN에 올라온 주식 대급락 경고입니다.
(http://kingworldnews.com/this-is-one-of-the-most-terrifying-charts-of-2017/)
아래는 소위 Sentimental Trade 인덱스인 Rydex fund bull index 입니다.

위 Rydex bull fund 인덱스는 1997년부터 2017.6.30일 까지의 기간동안 일반대중들이 $1당 얼마나 투자했는지를 수치화 한겁니다.
위 그림의 챠트에서 보다시피 1997년부터 시작된 IT 버블때 2000년 초에 주가지수가 최고점에 달했고, 그때부터 대중들의 주식투자가 어마어마하게 급등하기 시작합니다.
즉 S&P500 주가지수가 2000년 1~10월까지 가장 높았던 기간인데, 이때부터 일반대중들의 투자가 최고도에 달했고, 이를 수치적으로 보면 대략 $1당 $13투자를 한셈입니다.
2000년 3월과 10월정도에 쌍봉을 만들고 이후 S&P500 주가가 급락하기 시작했고, 2002년 말인 10월경에 바닥을 찍게됩니다. 즉 2000년10월부터 2002년 10월에 바닥찍을떄까지 2년간 하락후에 주가지수가 올라가게 됩니다.
--------------------------
2008년 리만급락때는 개인들이 별로 안당했지요? 이유가 2000년떄 데인 일반투자자들이 이후 ~2014년 초까지는 별로 주식 투자를 안했기 때문입니다.
그러다가 주가가 쭉 오르기 시작하자 역시 일반대중들은 S&P500 주가가 최고치에 달한 2015년에 6월에 최고치의 주식투자를 했고, 이는 2000년 고점을 돌파한 돌파한 $1당 $14 투자를 한셈입니다.
그리고 역시나 그떄부터 주식시작의 급락이 시작됩니다. 역시 2015년 7월이후 급락하게 됩니다.
--------------------------------
그리고 위 챠트처럼 다시 올해 2017년 6월 현재 Rydex bull fund 인덱스가 2015년 고점인 $1당 $14 근방에 도달한 시점입니다.
지금보다 쪼금 더올라가서 $15 까지 주가지수가 올라갈수도 잇지만, 투자자로서는 지금이 일단 잠시 주식투자 접어야 할때로 판단해야 할것 같습니다
즉 올 7,8월부터 급락이 시작될 가능성이 아주아주 높습니다. 만약 7,8월에 급락 안나오면 10월 급락은 더 높은 확률이 됩니다.
현재 여러가지 지표상 급락의 조짐이 나오는데, 실재 거래에 잇어서 나타나는 급락의 패턴이2가지가 잇는데,
- 먼저 하루 급락/하루 급등이 계속 나오구,
- 급락이 급등보다 조금 더 크게 나옵니다
이런 증상은 전형적인 급락징조입니다. 2008년 리만전에도 그랬고, 2015년 급락전에도 동일한 현상이 나옵니다.
이런 일일 급등/급락은 세력들이 지속적으로 개미들이 자금 빼지 못하게 하면서 지속적으로 물량 출회를 하는 현상입니다. 그기간이 3~4개월 정도라는 이야기입니다. 그래서 빠르면 7~8월이고 늦으면 10월 정도입니다.
이번 다가오는 급락이 마크파버가 언급한 2년간 40% 급락의 시작인지 아니면, 단기 3개월 10~15% 조정후 다시 대급등으로 갈지는 아직은 모릅니다. (다우지수는 ~19000선 선, 코스피는 2100선 정도까지)
어째든 최근에 펀드가입한 카페 회원분들은 지금 주식 상승은 매우 제한적이고 하락은 매우 큰 상태니 신중하게 대처하시기를.
=====================
The Public Is “All In” Again
June 30 (King World News) – From Jason Goepfert at SentimenTrader: Rydex traders are all in again. The traders who use the Rydex family of mutual funds are holding $14 in bullish index funds for every $1 they have in the inverse funds, a near-record level of confidence. They’re also holding more than $10 in leveraged bullish funds for every $1 in leveraged index funds, a highly optimistic positioning that led to declines. They have the lowest amount in the money market since 2000, so there isn’t much of a cushion against a fall…
IMPORTANT:
To hear which legend just spoke with KWN about $8,000 gold and the coming mania in the
gold, silver, and mining shares markets CLICK HERE OR on THE IMAGE BELOW.
… as of Wednesday, there was nearly $14 invested in the bullish index funds for every $1 invested in the inverse funds. Over the past 20 years, that ratio has been exceeded only once before, on March 2, 2015 (see remarkable chart below).
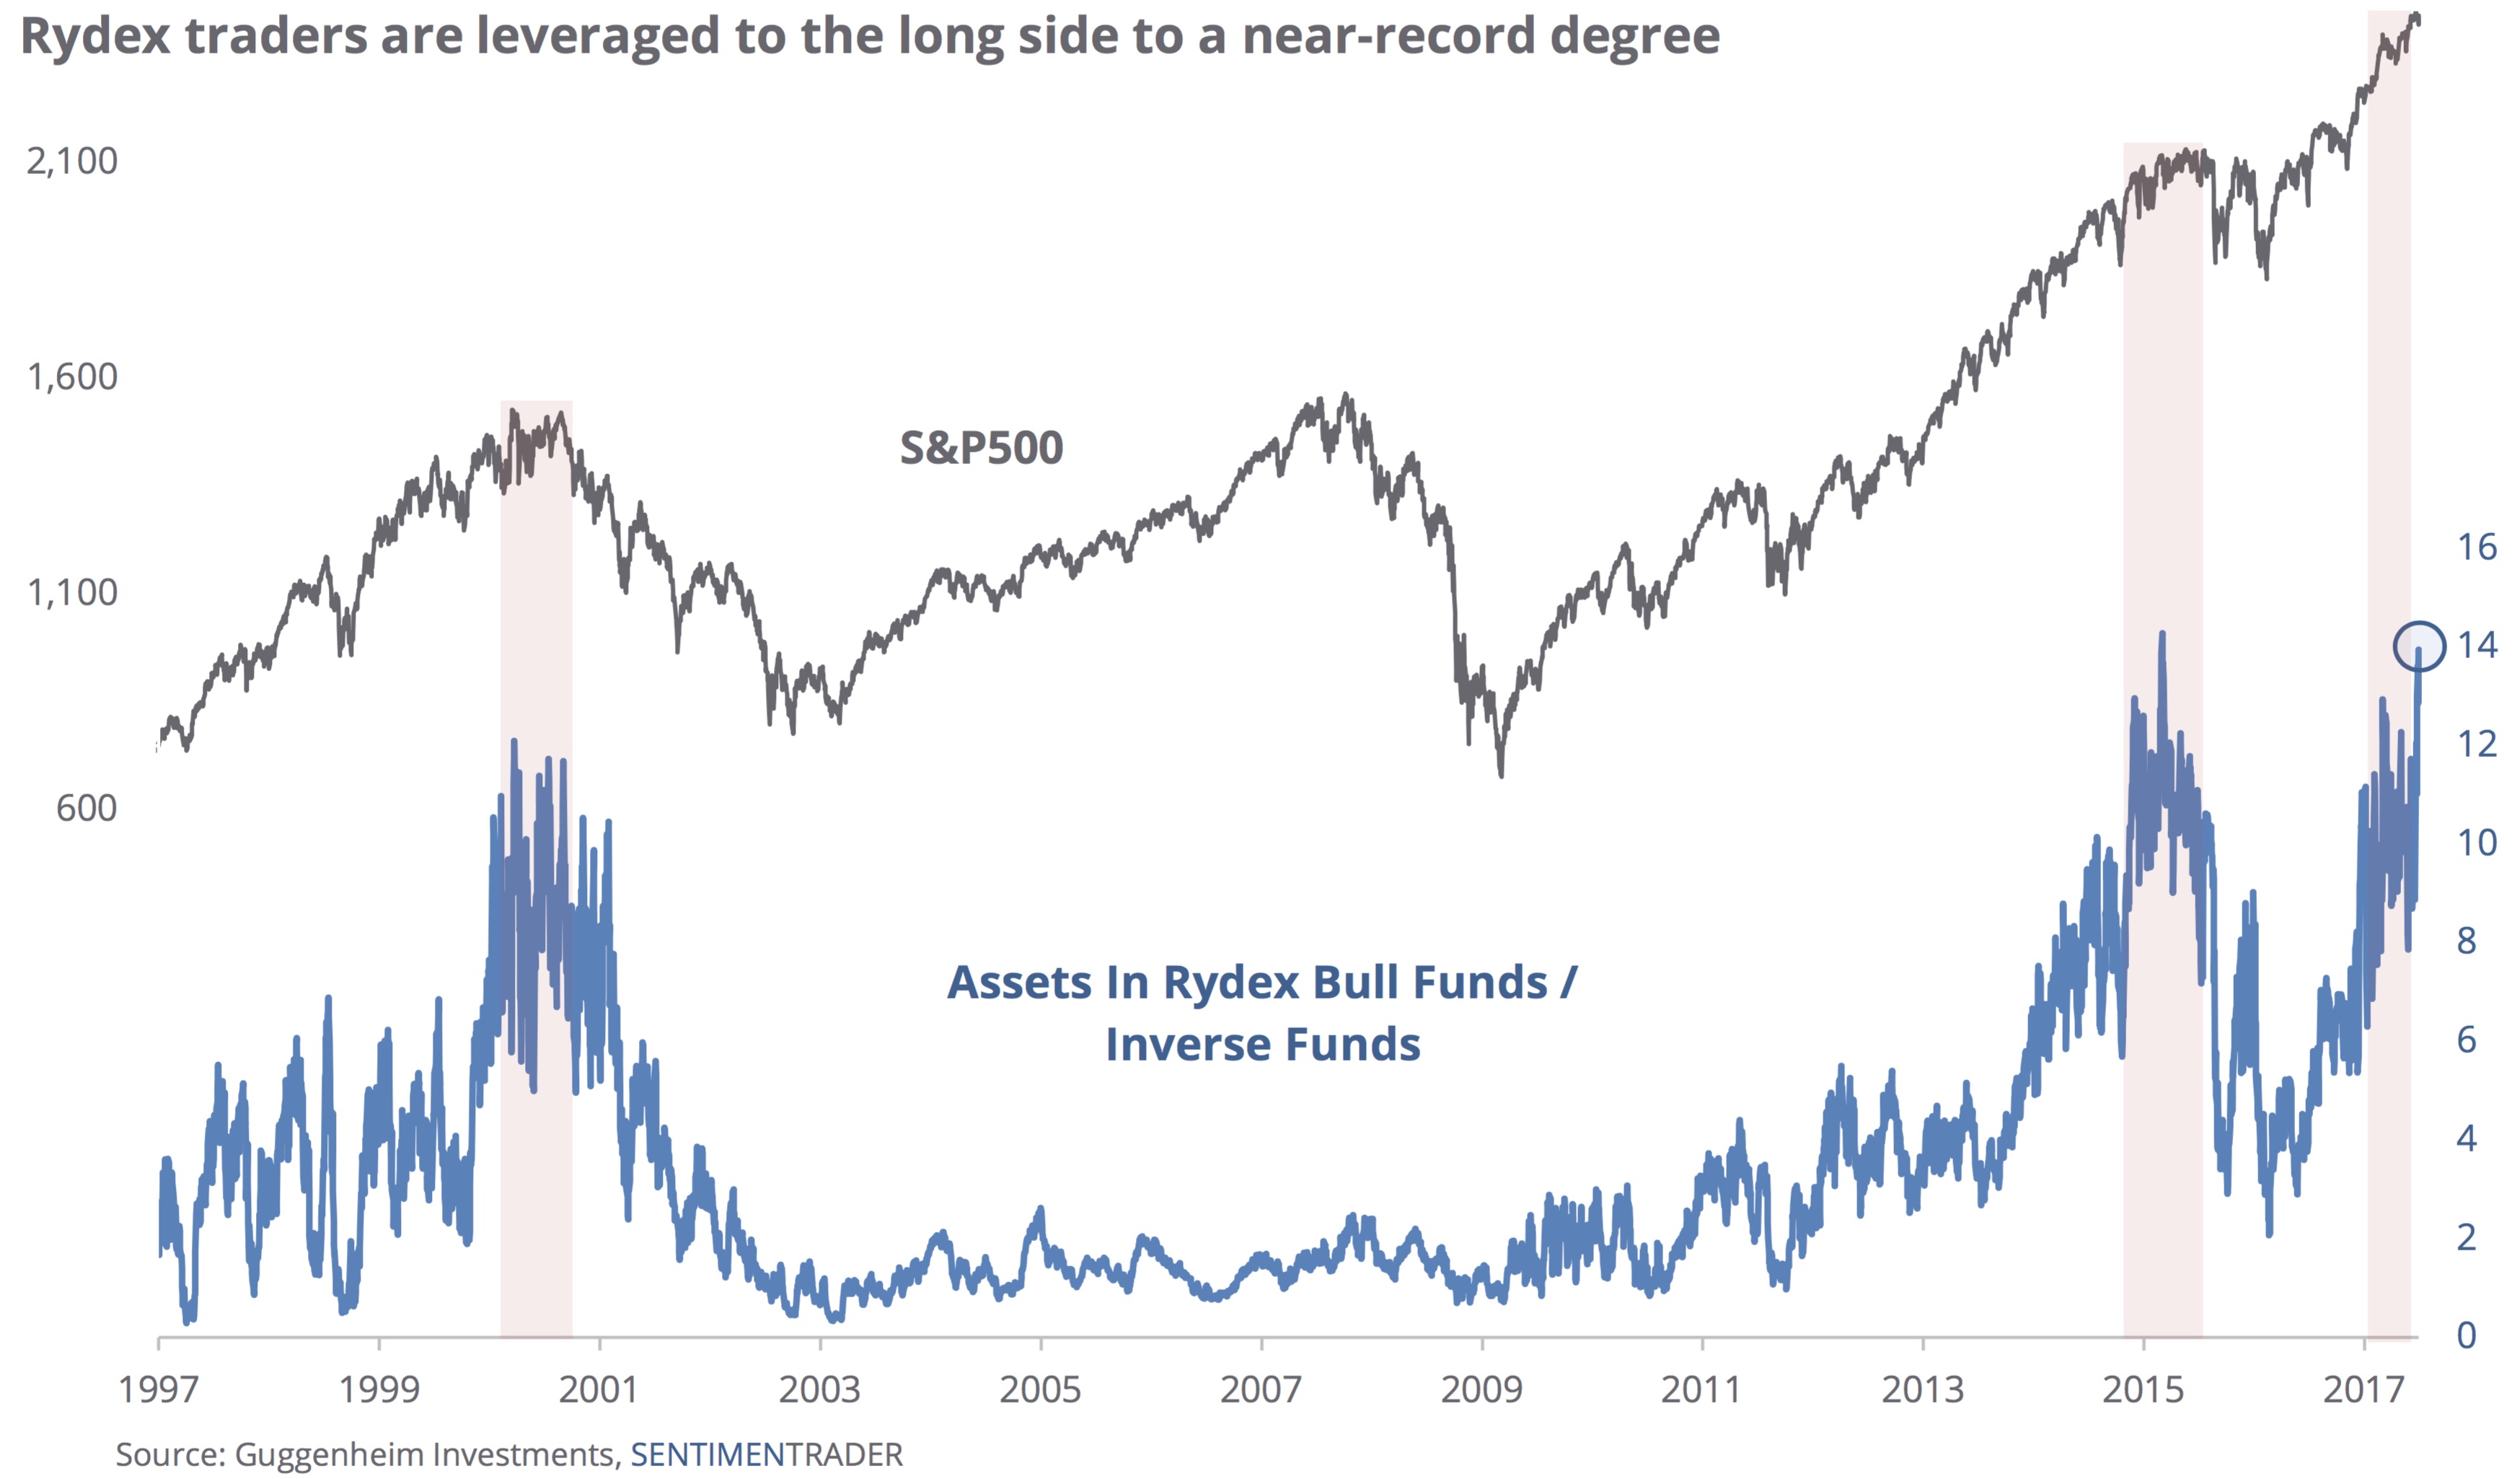
In the year 2000, the ratio barely exceeded 12 several times from March through September. Having been burned so badly by the ensuing decline, the traders never approached a similar extreme until 2014-15.
King World News note: The bottom line is that there will be a lot of pain for investors as a major decline in the stock market unfolds, and it will feed on itself as it plunges.
This piece is just one example of why Jason Goepfert is the best in the world at what he does. The chart and commentary above are from SentimenTrader. To try a free 14-day trial of the internationally acclaimed work that Jason Goepfert produces at SentimenTrader simply CLICK HERE.
'세계정세' 카테고리의 다른 글
| 이 세대는 결국 미국을 망가뜨리는 것인가? (0) | 2017.07.18 |
|---|---|
| 론폴의원은 붕괴가 그 어느때보다 가까워져 오고있다고 경고하다 (0) | 2017.07.10 |
| "9·11 테러 방불케 했다" 생존자들, 런던 고층아파트 화재 참상 전해 (0) | 2017.06.15 |
| G7의 악역이 된 트럼프 미 대통령.. 미국 주도의 종언, G7의 리더는 독불로 (0) | 2017.06.13 |
| '채권왕' 그로스, 美증시 거품 경고…"금융위기 이후 가장 위험" (0) | 2017.06.12 |